Expected Move is the amount that an asset is predicted to increase or decrease from its current price, based on the current levels of volatility.
Expected Move uses a maximum likelihood estimation for Asymmetric Laplace distribution parameters. This ensures a probability range more accurate than the more common expected moves based on a normal distribution assumption for returns. Asymmetric Laplace distribution It takes in account for fatter tails and volatility clustering during low volatility. So it will be thinner in the body (eg: <70% range) and fatter in the tails (>95% range) which fits the stock return better.
Comparison of Asymmetric Laplace and Normal Distribution fit:
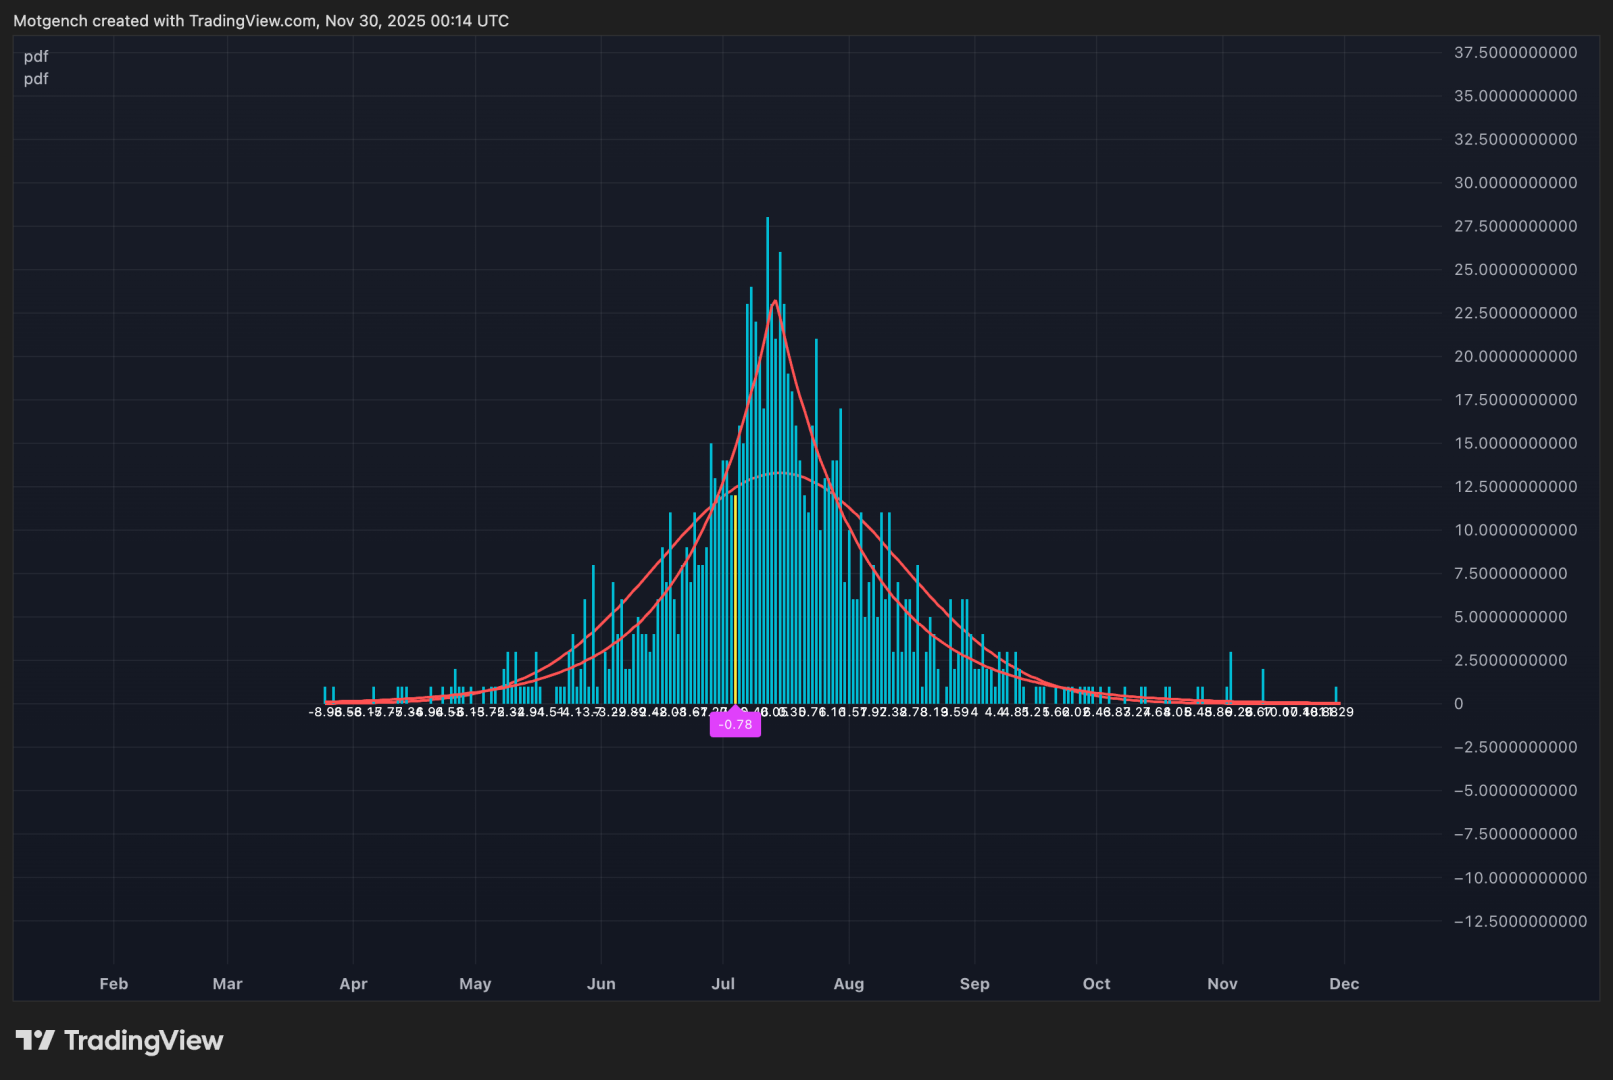
When we compare the more peaked asymmetric laplace to the bell curve shaped normal distribution we can see that the asymmetric laplace fits the empirical data (blue histogram) significantly better. The fit is improved in both the body (middle peaked part) as well as in the fatter tails (more of extreme occurrences far from the center)
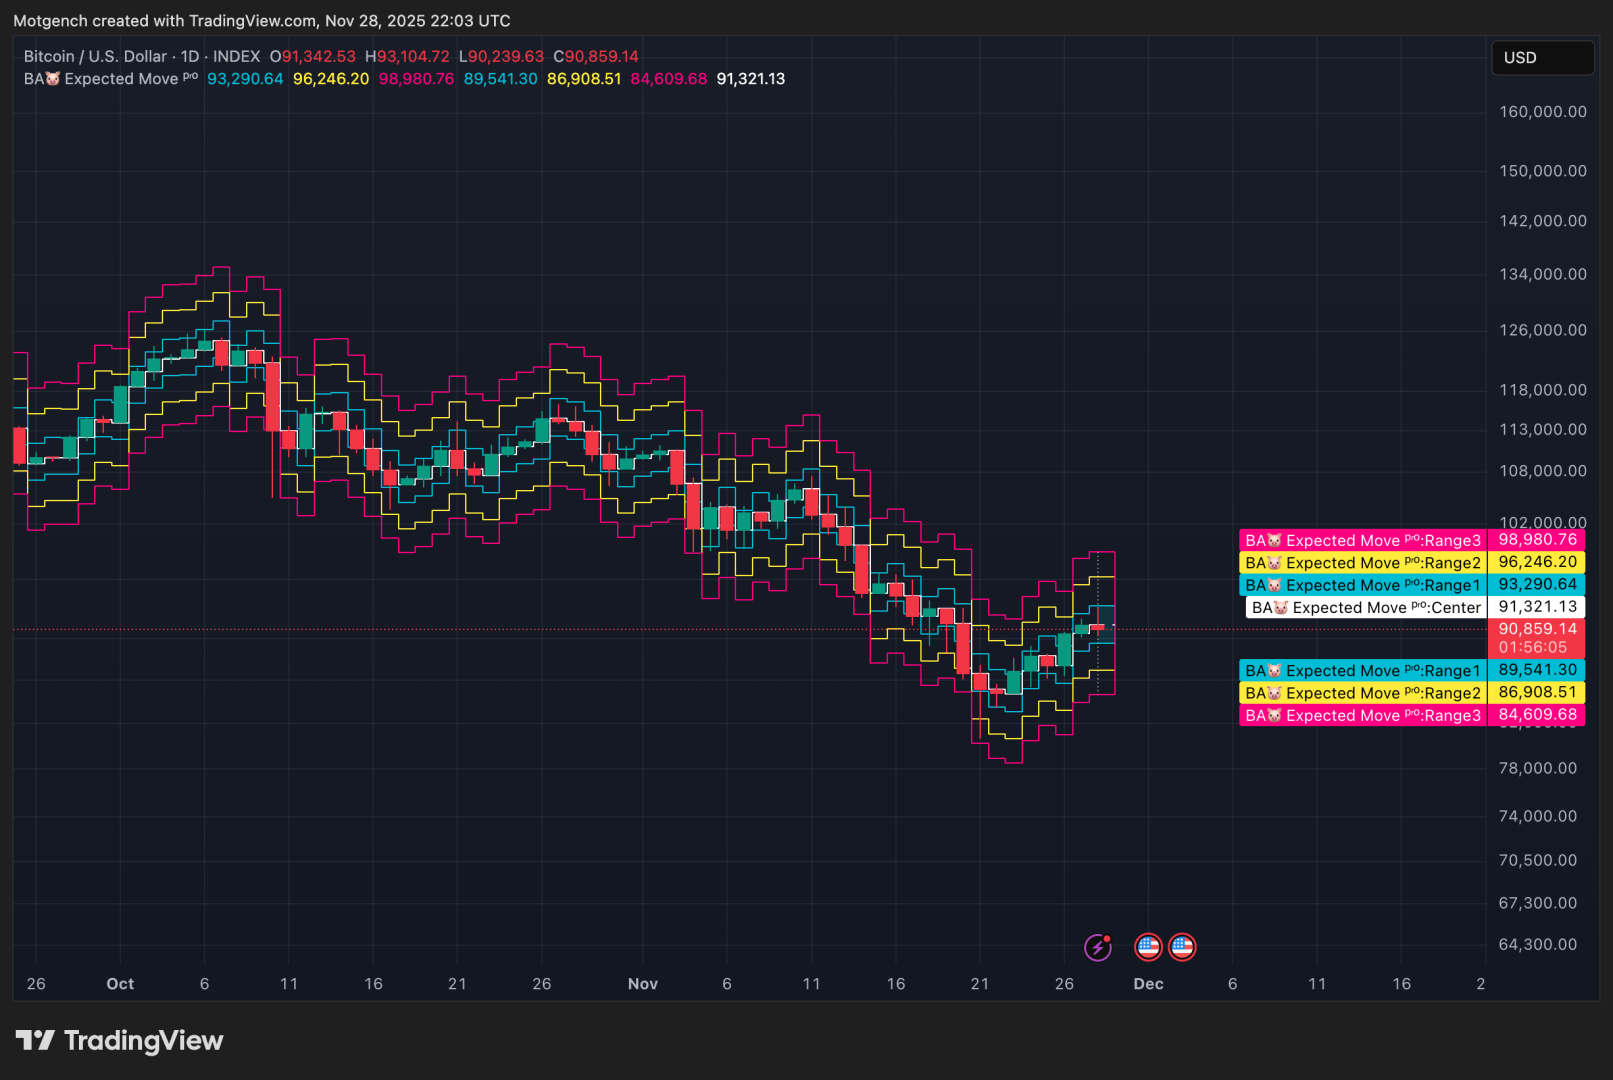
Expected moves:
In the expected move settings, the user can specify the range probability they wish to display. In a normal distribution a 1 standard deviation range corresponds to a range within which just under 70% of observations fall. So to specify a 70% probability range one would set 15% probability for both the upper and lower range.
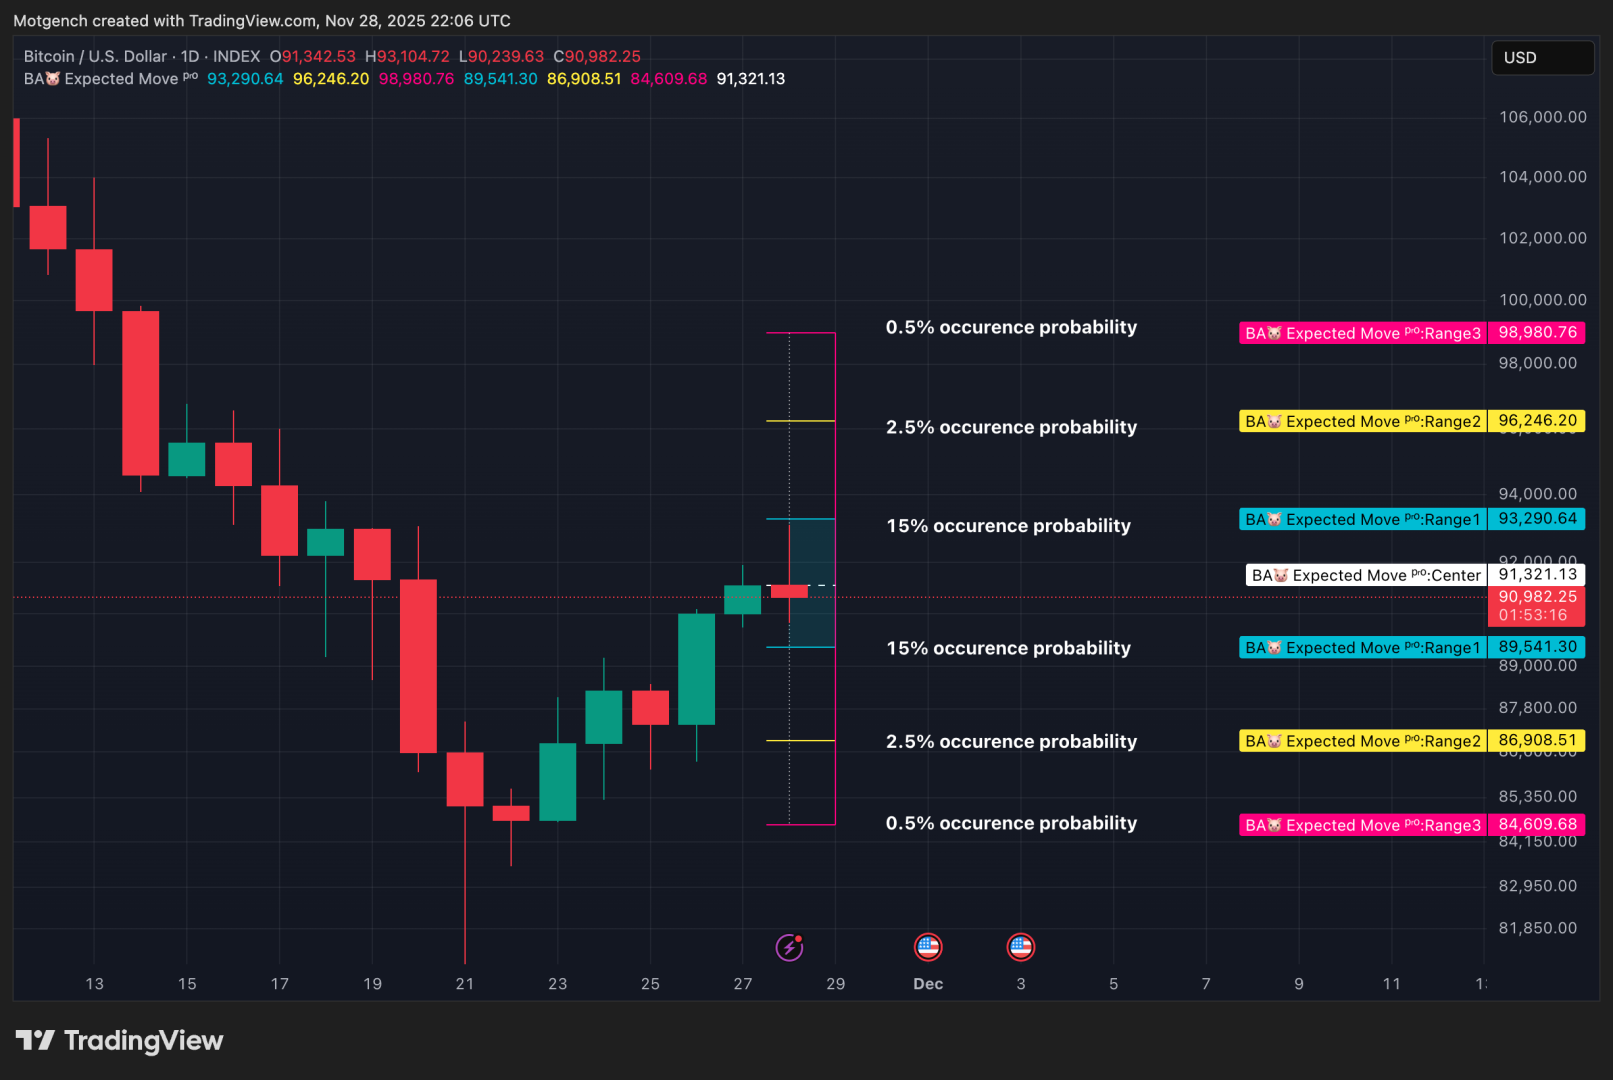
Expected Moves with different ranges specified by the occurence probability:
Below we can see the probability ranges corresponding to the 70%, 95% and 99% confidence intervals.
Multi time frame function allows you to run the expected move band on higher time frame than current time frame.
Multi Timeframe Expected Moves:
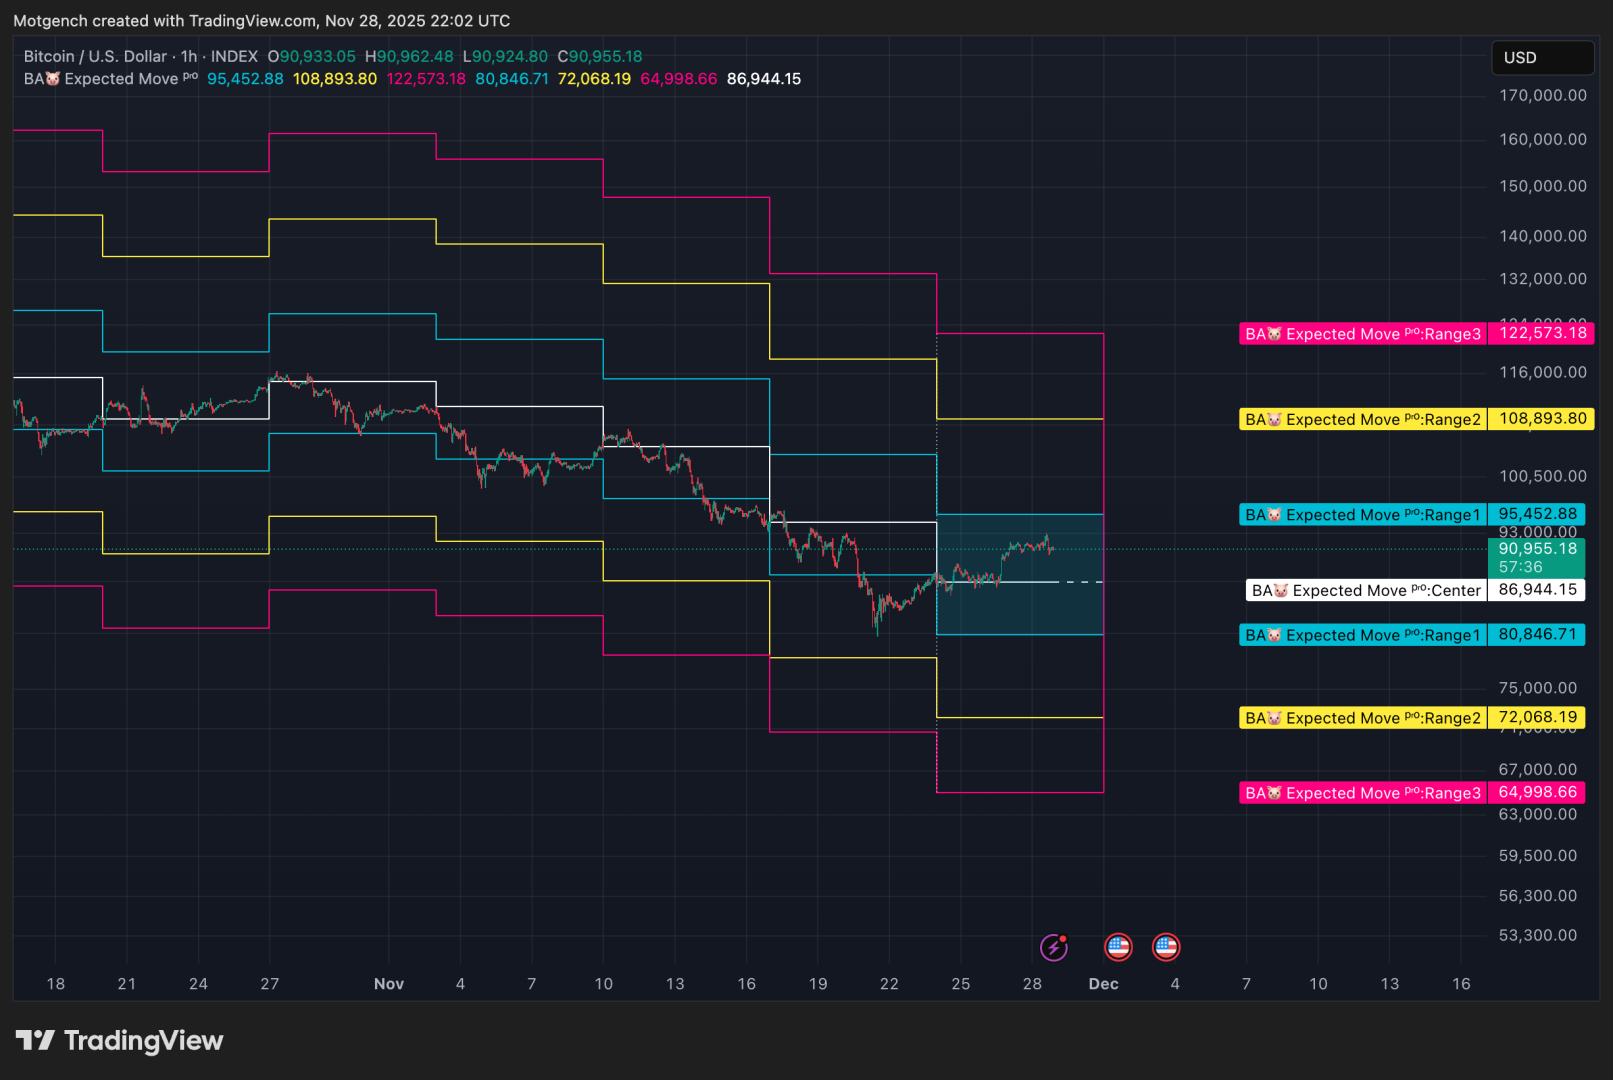
Above we can see a weekly expected move on an hourly chart.
Expected Move indicator Link :